Below is our AP Statistics unit 1 practice test. These questions explore different categorizations of data (discrete, continuous, quantitative, qualitative) and ways of representing the data graphically, including dot-plots, bar graphs, histograms, and tables. Z-score is also covered, as a way to compare values across different distributions.
Congratulations - you have completed .
You scored %%SCORE%% out of %%TOTAL%%.
Your performance has been rated as %%RATING%%
Your answers are highlighted below.
Question 1 |
On a school survey, age, gender, height, GPA, and highest level of education are recorded. The number and type of variables recorded is:
5 quantitative, 0 categorical | |
3 quantitative, 2 categorical | |
2 quantitative, 2 categorical | |
2 quantitative, 3 categorical |
Question 1 Explanation:
The correct answer is (B). In this survey, 5 variables are measured: age, gender, height, GPA and highest level of education. Quantitative variables are variables that take on numerical values for a measured or counted quantity. The 3 quantitative variables are age (measured in number of years), height (measured in inches or centimeters), and GPA (measured on a 4-point scale).
A categorical variable takes on values that are category names or group labels. The 2 categorical variables are gender and highest level of education.
A categorical variable takes on values that are category names or group labels. The 2 categorical variables are gender and highest level of education.
Question 2 |
Which of the following variables are discrete?
I. Number of students entering a race
II. 100-meter dash times in a race
III. Height of competitors in a race
IV. Age of competitors in a race
I | |
II, III, and IV | |
I and IV | |
None of the above |
Question 2 Explanation:
The correct answer is (A). The number of students entering a race is the only discrete variable. The number of students can’t be divided into smaller parts, but time, age, and height can be divided into smaller and smaller fractions of units.
Question 3 |
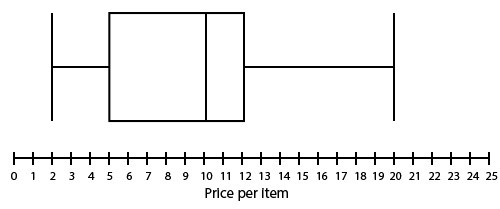
The boxplot shows the data gathered based on 100 purchases at a craft vendor’s table. Based on the results, half of all purchases fall between which two price points?
\$2 and \$5
| |
\$2 and \$2 | |
\$5 and \$20 | |
\$5 and \$12 |
Question 3 Explanation:
The correct answer is (D). A box plot shows the quartiles of a data set, with each segment (whisker-to-box or each half of the box) representing one-quarter of the data. Therefore the segment \$5–\$12, which spans both parts of the box, represents 50% of the data.
Question 4 |
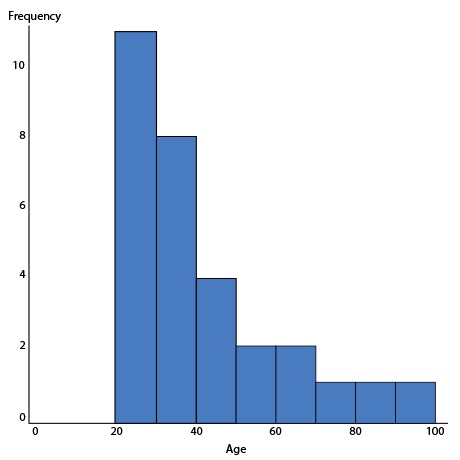
The histogram below shows the age of 30 employees of a company. Which of the following statements is correct?
The distribution is symmetric. | |
The distribution is skewed to the right. | |
The distribution is skewed to the left. | |
We are not able to determine the type of distribution |
Question 4 Explanation:
The correct answer is (B). Most of the data appears on the left hand side of the histogram. There is no “center” value and there are a few data points pulling the data to be skewed to the right.
Question 5 |
The histogram below shows the age of 30 employees of a company. Determine the median age range.

Between 40 and 50 | |
Between 50 and 60 | |
Between 20 and 30 | |
Between 30 and 40 |
Question 5 Explanation:
The correct answer is (D). Since there are 30 data points, the median would be the 15th data point when they are in order from least to greatest. The first column represents the first 11 data points in order, the second column represents the next 8 data points. The 15th data point is in column two which is the range 30 to 40. The median age range is between 30 and 40.
Question 6 |
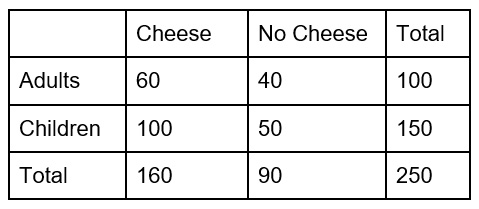
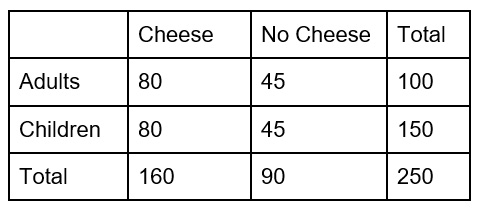
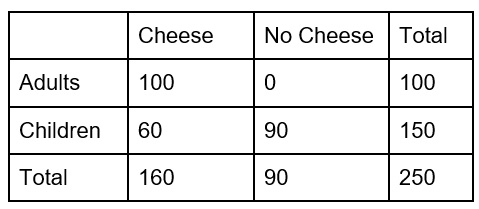
At a burger stand, 250 people were surveyed on whether they preferred eating their burgers with cheese or no cheese. Of the 250 people surveyed, 100 were adults and 150 were children. Of the responses, 160 people said they prefer cheese and 100 of those were children.
Which of the following tables shows the distribution of responses?
 | |
 | |
 | |
 |
Question 6 Explanation:
The correct answer is (A). First fill in the numbers that we know.
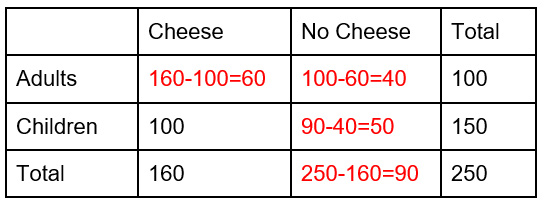 For each column and row, the cells have to add to the total. We can use addition and subtraction to find what is in the missing boxes.
 For each column and row, the cells have to add to the total. We can use addition and subtraction to find what is in the missing boxes.
 Question 7 |
Consider the dot plot below.
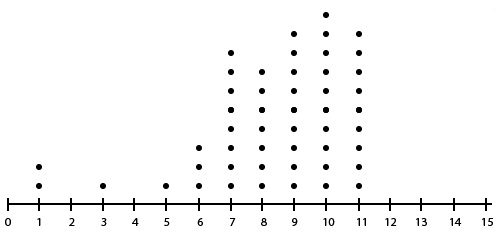
What is the 5 number summary of the distribution above?
1, 7, 9, 10, 11 | |
1, 7, 10, 11, 11 | |
1, 8, 9, 10, 11 | |
1, 9, 10, 10, 11 |
Question 7 Explanation:
The correct answer is (A). The five number summary consists of the minimum, first quartile (Q1), median, third quartile (Q3), and the maximum. If we count cleverly (imagine the five high columns are columns of 9 each, then add one and subtract three for the extra one and the missing three dots, then add the other seven), we can quickly see that there are 50 values, so we need the minimum, the 13th (the median of the bottom 25), the 25/26th (we would take the average but they're the same), the 38th (the median of the top 25), and the maximum.
The minimum value is 1.
The maximum value is 11.
The median is the point exactly in the middle (average of 25–26th values) which is 9.
The first quartile is the median of the first half of the data (13th value) which is 7.
The third quartile is the median of the second half of the data (38th value) which is 10.
Question 8 |
The results of a classroom set of test scores is below. Which option displays the correct box plot for the data?
60, 62, 64, 64, 72, 75, 78, 80, 80, 81, 81, 82, 85, 89, 92, 94, 97
 | |
 | |
 | |
 |
Question 8 Explanation:
The correct answer is (A). The median of the data set is the middle number, 80. Quartile one is the middle of the bottom half, 68, which is the average of 64 and 72. Quartile three is the middle of the top half, 87, which is the average of 85 and 89.
Question 9 |
The height of a selected sample of boys in the United States is normally distributed with a mean of 64 inches and a standard deviation of 0.5 inches. The height of a selected sample of girls is normally distributed with a mean of 62 inches and a standard deviation of 0.4 inches.
Approximately what is the height of a boy with the same z-score as a girl with a height of 63 inches?
62.75 inches | |
65.25 inches | |
63.25 inches | |
64.75 inches |
Question 9 Explanation:
The correct answer is (B). The formula for z-score is $\dfrac{(x − μ)}{σ}$, where $x$ is the observed value, $μ$ is the mean, and $σ$ is the standard deviation.
$\dfrac{(63 − 62)}{0.4} = \dfrac{(x − 64)}{0.5}$, giving an $x$ value of 65.25.
$\dfrac{(63 − 62)}{0.4} = \dfrac{(x − 64)}{0.5}$, giving an $x$ value of 65.25.
Question 10 |
Which of the following are true about bar graphs?
I. They summarize quantitative data
II. They summarize categorical data
III. The order of the categories is important
IV. They can display frequencies or relative frequencies
II, III, and IV | |
II and III | |
I and IV | |
II and IV |
Question 10 Explanation:
The correct answer is (D). A bar graph is used to display categorical data. It is often mistaken for a histogram which displays qualitative data and does not have space between the bars. It can display frequencies (counts) or relative frequencies (proportions). The order of the categories does not matter and every bar represents a different category.
Once you are finished, click the button below. Any items you have not completed will be marked incorrect.
There are 10 questions to complete.
|
List |
Next Practice Test:
Exploring Two-Variable Data >>
AP Statistics Main Menu >>
