Try our AP Stats unit 2 practice test. These questions explore relationships between two variables measured for one individual (for example, the height and weight for one person), across many individuals (the sample). The focal points of this topic are correlation, regression, and residuals, though quantitative or categorical data also makes an appearance.
Congratulations - you have completed .
You scored %%SCORE%% out of %%TOTAL%%.
Your performance has been rated as %%RATING%%
Your answers are highlighted below.
Question 1 |
From 2010–2020, the correlation coefficient between students’ performance on the NJ graduation exams and the NJ graduation rate is 0.885. Based on this information, which of the following statements are true?
Everyone who passed the exam automatically graduates. | |
There was a strong correlation between passing the exam and graduating. | |
There was no correlation between the NJ graduation exam and the graduation rate. | |
A and B |
Question 1 Explanation:
The correct answer is (B). While the two variables have a strong correlation (correlation coefficient close to 1), this does not mean that one variable caused the other.
Question 2 |
A botanist collected data on growth patterns for a given plant over 5 weeks and a least squares regression line was fitted to the data. The resulting equation was $ŷ = 3 + 0.25x$ where $x$ is the number of weeks and $y$ is the height of the plant in centimeters. What can be concluded from this equation?
I. The plant was 0.25 cm tall when first measured.
II. The plant grew at an average rate of 0.25 cm per week.
III. The plant grew at an average rate of 3 cm per week.
IV. In 3 more weeks, given the same growth rate, the plant will be approximately 5 cm tall.
V. In 3 more weeks, given the same growth rate, the plant will be approximately 3.75 cm tall.
Statements I and III | |
Statements II and IV | |
Statements II and V | |
None of the above |
Question 2 Explanation:
Linear regression models follow the form $y=a+bx$ where $x$ is the explanatory variable, $y$ is the dependent variable, and $b$ is the slope, or the change over time. In this case, the plant was 3 cm tall when first measured (the y-intercept), and grew at an average rate of 0.25 cm per week. In 3 additional weeks, the plant’s predicted growth will be:
$3+0.25(8) = 3+2 $ $ = 5 \text{ cm}$
$3+0.25(8) = 3+2 $ $ = 5 \text{ cm}$
Question 3 |
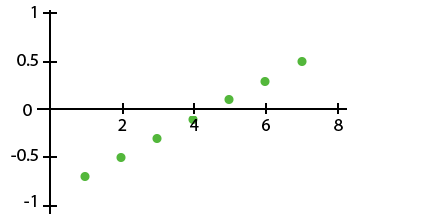
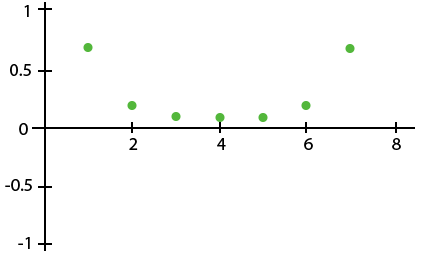
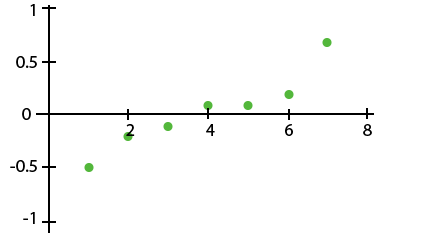
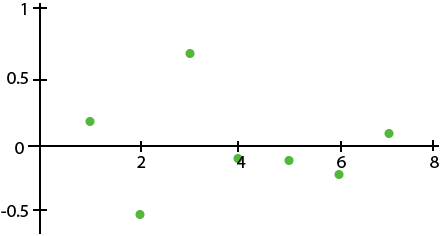
Which of the following residual plots indicates a linear association between the variables?
 | |
 | |
 | |
 |
Question 3 Explanation:
The correct answer is (D). Residual plots that indicate a linear association will be roughly scattered above and below $y$ = 0. The only plot that fits this characteristic is (D). The other plots show a pattern that would indicate that nonlinear association is more suitable.
Question 4 |
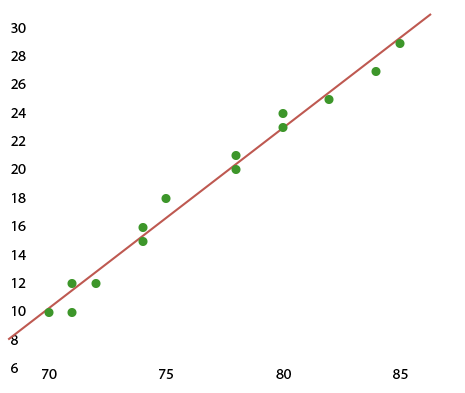
What can we say about the correlation for that data shown in the scatter plot?
I. Positive correlation
II. Negative correlation
III. Strong correlation
IV. Moderate correlation
V. Weak correlation
I and III | |
II and III | |
I and IV | |
I and V |
Question 4 Explanation:
The correct answer is (A). The graph shows both variables increase together, indicating a positive correlation. The data is clustered fairly tightly along the line, indicating a strong correlation.
Question 5 |
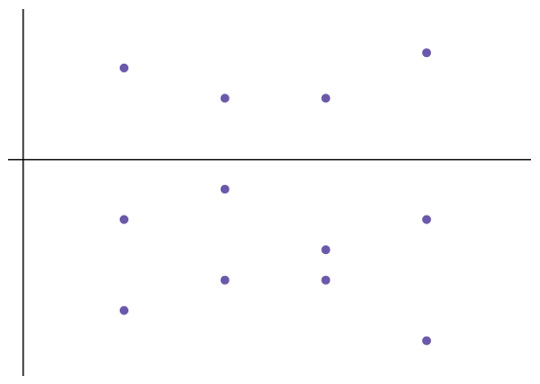
A student created a least squares regression line, then calculated residuals to determine if it was the most appropriate line for the data. The student got the residual plot shown. What is true about the least squares regression line?
The line underestimates the data. | |
The line overestimates the data. | |
A non-linear model would be more appropriate. | |
The least squares regression line is correct. |
Question 5 Explanation:
The correct answer is (B). Each residual is the actual value minus the value predicted by the regression line, so negative values mean that the actual values are below the predicted values. If a linear least squares regression line is the correct line for the data, then the residuals will be scattered above and below the axis in the blot. Because more of the residuals are below the line, but the residuals don’t follow any other pattern, it indicates that a linear model is the best fit, but most of the data points are below the least squares regression line and the line overestimates the data. If the line were moved down, the residuals would be more evenly split between below and above the line and that would be the right fit.
Question 6 |
The following table shows the data collected from a group of boys and girls about their favorite beverage.
| Coffee | Tea | Soda | Other | Total | |
| Boys | 10 | 5 | 3 | 2 | 20 |
| Girls | 8 | 7 | 2 | 3 | 20 |
| Total | 18 | 12 | 5 | 5 | 40 |
Which of the following statements is supported by the table?
Tea was the beverage chosen least often by the boys in the group. | |
Coffee was the beverage chosen most often by the people in the group. | |
The percentage of people in the group who chose tea was 12%. | |
The percentage of girls in the group who chose soda was 2%. |
Question 6 Explanation:
The correct answer is (B). The total number of people who chose coffee (18) is greater than the total number of people who chose tea (12), soda (5) or other (5).
Question 7 |
The following data were collected from a random sample of people, who identified their favorite animal. The results are shown in the following two-way table.
| Dog | Cat | Snake | Bird | Flamingo | Total | |
| Men | 250 | 150 | 25 | 50 | 25 | 500 |
| Women | 200 | 200 | 50 | 30 | 20 | 500 |
| Total | 450 | 350 | 75 | 80 | 45 | 1000 |
Which of the following statements are true based on the information in the two way table?
I. The proportion of men who identified bird as their favorite animal is 50/500.
II. The proportion of women who identified cat as their favorite animal is 200/1000.
III. The proportion of people who identified dog as their favorite animal is 450/1000.
I only | |
III only | |
I and III | |
I, II and III |
Question 7 Explanation:
The correct answer is (C).
I. True: There are 500 men, and 50 of the men identified bird as their favorite animal, so 50/500 is the proportion of men who identified bird as their favorite animal.
II. False: There are 500 women, and 200 of the women identified cat as their favorite animal, so 200/500 is the proportion of women who identified cat as their favorite animal, not 200/1000.
III. True: There are 1000 total people, and 450 of them identified dog as their favorite animal, so 450/1000 is the proportion of people who identified dog as their favorite animal.
Question 8 |
The equation $y = 2.579 + 0.99x$ represents the least squares regression line that summarizes the relationship between the height ($y$) in centimeters of a certain plant in respect to time ($x$) in days recorded by a scientist over the past month. What does the scientist predict the height of the plant will be after 10 days?
2.579 | |
0.99 | |
3.569 | |
12.479 |
Question 8 Explanation:
The correct answer is (D). 10 days is the $x$ value used to find the predicted height ($y$) by plugging 10 in for $x$ in the least squares regression formula:
$y = 2.579 + 0.99(10) $ $ = 12.479$
$y = 2.579 + 0.99(10) $ $ = 12.479$
Question 9 |
A data analyst collected data to predict monthly subscribers to a youtube channel from monthly social media posts. The model created from the data showed that 49 percent of the variation in monthly subscribers could be explained by monthly social media posts. What is the value of the correlation coefficient?
0.70 | |
0.49 | |
0.24 | |
0.98 |
Question 9 Explanation:
The correct answer is (A). The proportion of the variation explained by the explanatory variable
is called “R squared” because it is the square of “r”, the correlation coefficient.
The correlation coefficient is the square root of the proportion of the variation explained by the explanatory variable, which is 0.49 in this case:
$\sqrt{0.49} = 0.70$
The correlation coefficient is 0.70.
The correlation coefficient is the square root of the proportion of the variation explained by the explanatory variable, which is 0.49 in this case:
$\sqrt{0.49} = 0.70$
The correlation coefficient is 0.70.
Question 10 |
In a set of data, an exponential relationship exists between the response and explanatory variables. After taking the common logarithm of each response variable value, the equation of the least-squares regression line is $\log(y) = 4.6 - 1.2x$.
Which of the following numbers represents the predicted value of the response variable for $x$ = 2.9.
4.6 | |
1.12 | |
2.9 | |
13.18 |
Question 10 Explanation:
The correct answer is (D). Substituting $x$ = 2.9 into the equation gives:
$\log(y) = 4.6 − 1.2 (2.9)$
$\log(y) = 1.12$
Raising 10 to the power of 1.12 to solve for $y$ gives the value 13.18:
$10^{\log(y)} = 10^{1.12}$
$y=13.18$
$\log(y) = 4.6 − 1.2 (2.9)$
$\log(y) = 1.12$
Raising 10 to the power of 1.12 to solve for $y$ gives the value 13.18:
$10^{\log(y)} = 10^{1.12}$
$y=13.18$
Once you are finished, click the button below. Any items you have not completed will be marked incorrect.
There are 10 questions to complete.
|
List |
Next Practice Test:
Collecting Data >>
AP Statistics Main Menu >>
